Spreadsheet-to-dashboard automation for business KPIs.
A data automation system for teams that rely on spreadsheets but need cleaner dashboards for operating decisions.
Spreadsheet Dashboard made the workflow easier to explain: the inputs, AI review, human handoff, and business action are all visible in one place.
— Product team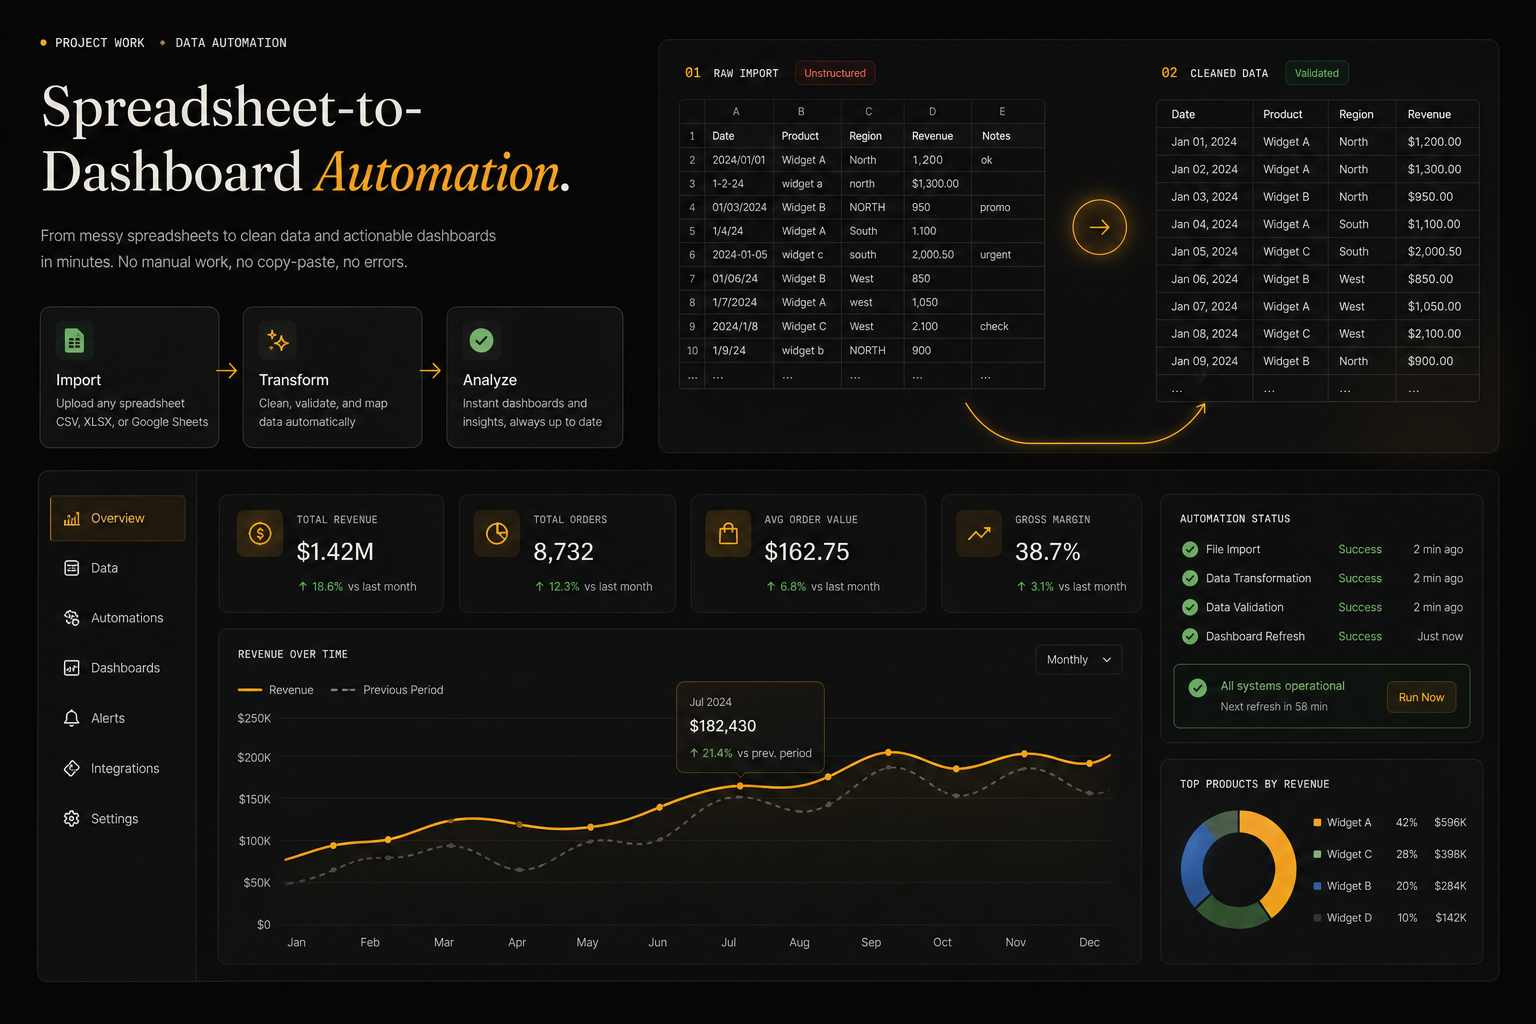
Messy files normalized
Rules fix common errors
Core metrics are visible
Trends update automatically
Spreadsheets carry important business data, but they are rarely dashboard-ready.
Teams need to import messy files, clean common issues, calculate KPIs, and publish charts without rebuilding the report every week.
The workflow needed a visual and operational story that buyers can scan quickly: what comes in, what the AI does, what a human reviews, and where the result lands.
Column names, formats, and missing values vary between exports.
KPIs depend on definitions that need to stay explicit.
Bad rows should be reviewed instead of silently removed.
The workflow has to repeat without manual rebuilding.
We made the transformation from raw sheet to KPI dashboard visible.
The automation workspace shows import state, cleaned table rows, metric cards, and charts so the workflow feels concrete.
The project is framed around the business workflow itself: the source inputs, AI review, approval points, and final handoff are all visible in one story.
- Spreadsheet import with validation state.
- Cleaned data table and missing-value checks.
- KPI cards for business metrics.
- Revenue or operations chart output.
Import preview
Raw rows are visible before transformation.
Validation state
Missing or suspect data gets flagged clearly.
KPI cards
Decision metrics are separated from raw tables.
Refresh path
The dashboard is designed as a repeatable workflow.
Workflow audit
Mapped source inputs, users, review points, and the final business action.
AI task design
Defined classification, extraction, drafting, prediction, or detection responsibilities.
Human review path
Added approval, exception, and escalation points where judgment matters.
Product narrative
Turned the workflow into a clear buyer story for sales conversations, reviews, and handoff.
- CSV files
- Google Sheets
- Exports
- Manual notes
- Column mapping
- Deduping
- Validation
- Normalization
- KPI formulas
- Trend checks
- Anomaly flags
- Segments
- Charts
- Scheduled refresh
- Exports
- Alerts
Spreadsheet automation works when the team can trust the cleanup rules before they trust the dashboard.
Clearer product surface: Spreadsheet Dashboard now communicates the workflow through the actual review states, handoffs, and outcomes buyers care about.
Faster buyer clarity: the problem, workflow, proof points, and next action are easy to understand without a technical walkthrough.
Spreadsheet Dashboard made the workflow easier to explain: the inputs, AI review, human handoff, and business action are all visible in one place.
- CSV files
- Google Sheets
- Exports
- Manual notes
- Column mapping
- Deduping
- Validation
- Normalization
- KPI formulas
- Trend checks
- Anomaly flags
- Segments
- Charts
- Scheduled refresh
- Exports
- Alerts
- Human review
- Audit trail
- Quality checks
- Fallback rules
Got a problem AI might solve? Let's find out.
30 minutes. Free. No NDA needed. You leave with a clear yes-or-no on whether to build — and a one-pager you can forward to your team the same day.